Teen Payroll
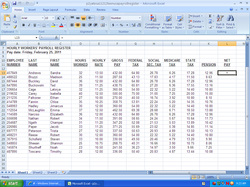
This is a spreadsheet called Teen Payroll. I did this activity in my microsoft office class. Unlike all the previous assignments this one was not completed in Microsoft Office 2007, or Microsoft Office Publisher. This was complteated in Microsoft Excel which is used to do spreadsheets. This activity required many different fonts, font effects, and formulas. The spreadsheet is about teen jobs, the hours they work, how they get paid, and the rate percent they get paid. The first thing I had to do was type in the information that was already given to me which was the employee numbers, first and last name, hours worked, and hourly rate. In order to know the rest of the information which includes, gross pay, federal tax, social security tax, medicare tax, state tax, and pension. In order to find all that information I had to put in different formulas. To find the gross pay I used the formula =D13*E13 which in this case ment the hours worked times the hourly rate, then i used the auto fill feature to fill in the rest for gross pay. To find the federal tax I used the formula =F13*15% which in this case ment the hours worked times 15% then I used the autofill feature to fill in the rest of the federal tax. To find the social security tax I used the formula =F13*6.2% which in this case ment the hours worked times 6.2% then I used the autofill feature to fill in the rest of the social security tax. To find the medicare tax I used the formula =F13*1.45% which in this case ment the hours worked times 1.45% then I used the auto fill feature to fill in the rest for the medicare tax. To find the state tax I used the formula =F13*4% which in this case ment the hours worked times 4% then I used the autofill feature to fill in the rest of the state tax. Finally, to find the pension I used the formula =F13*3% which in this case measn the hours worked times 3% then I used the autofill feature to fill in the rest for pension.
Problem #22 Formula Features
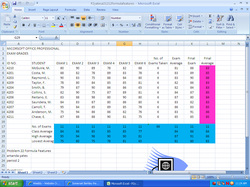
This activity I did in microsoft class is called problem #22 formula features. This activity was about a grade book for student tests/quizzes. I already had alot of the information when I recieved the activuty. For instance I already had the student number, the student name, exam 1, exam 2, exam 3, exam 4, exam 5, exam 6, and the final exam. The information had to figure out because I didnt have was the number of exams taken, the exam average, the final average, the number of exams total, the class average, the highest average, and the lowest average. To find the number of exams taken I had to use the formula =count(C5:H5) which added up the number of quizzes the person took. Then I used the autofill feature to fill in the rest. To find the exam average I had to use the formula =average(c5:h5) which ment it you added up all the quiz scores and divide by 6 because thats how many quizzes there were. Then I used the autofill to fill in the rest. To find the final average I used the formula =(k5+j5+j5)/3 which was the final exam plus the exam average divided by 3. Then I used the auto fill for the rest of them. To find the number of exams I used the formula =count(c5:c15) which ment to just count the number of exams in those columns, then I used the auto fill to fill in the rest. To find the class average I used the same formula for the number of exams but instead of using =count I used =average, and I also used autofill to fill in the rest. To find the high and low average I used the same formula which is (c5:c15) but for the high average in the front I used =Max and infront of the low average I put =min, and I used the autofill to fill in the rest.
Activity #48 Raise
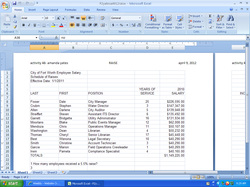
This activity was called activity #48 raise. This activity seemed fairly easy and short because I had most of the information already and there was not much calculating. I alreasdy had the first and last name, the position, the years of service and the salary. What I had to find was the sum of all the salaries. The formula was =sum(e8:e20) which just added up and the salaries. Then I had to find out how many people recieved a 5.5% raise. Them I had to find out how many employees recieved a 4% raise. Then I had to find out which employee had the highest salary for 2011, and which employee had the lowest salary for 2011. Lastly I had to find out if the employee with the fewest years of service had the lowest salary.
Conditional Formatting Powerpoint
This is my conditional formatting powerpoint. This was a group project. I worked with Hailey, and Sarah. For this project we also had a microsoft and excel part of the project also. We just had to say what conditional formatting is and how to use it, and what the different efffects are when you use it. Condotional formatting is used in excel.
